Net Promoter Score (NPS) has become the gold standard for measuring customer loyalty and predicting business growth. But calculating NPS correctly is just the starting point. The real value comes from understanding what your score means, why customers rate you the way they do, and most importantly, how to systematically improve it.
What is Net Promoter Score (NPS)?
Net Promoter Score is a customer loyalty metric developed by Fred Reichheld in 2003. It measures how likely customers are to recommend your product or service to others on a scale from 0 to 10.
The beauty of NPS lies in its simplicity: one question can predict customer loyalty, revenue growth, and long-term business health.
The NPS question: "On a scale of 0-10, how likely are you to recommend [company/product] to a friend or colleague?"
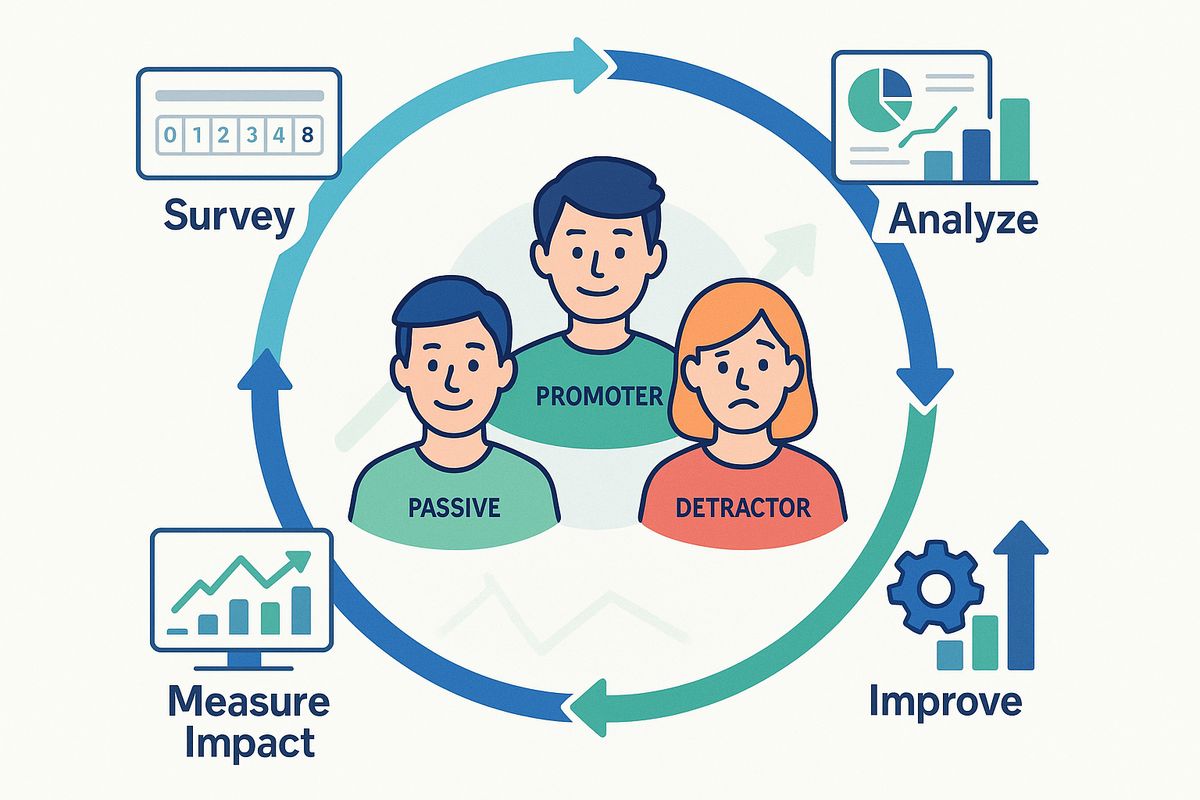
Based on their response, customers fall into three categories:
- Promoters (9-10): Loyal enthusiasts who will keep buying and refer others, fueling growth
- Passives (7-8): Satisfied but unenthusiastic customers who are vulnerable to competitive offerings
- Detractors (0-6): Unhappy customers who can damage your brand through negative word-of-mouth
How to calculate NPS: the formula
Calculating your Net Promoter Score is straightforward once you understand the formula.
The NPS formula
NPS = % Promoters - % Detractors
Note that Passives are not included in the calculation, though they're still important for understanding your overall customer sentiment.
Step-by-step NPS calculation
Let's walk through a real example:
Step 1: Collect responses
You survey 200 customers and get these responses:
- 120 customers rated 9-10 (Promoters)
- 50 customers rated 7-8 (Passives)
- 30 customers rated 0-6 (Detractors)
Step 2: Calculate percentages
- Promoters: 120 ÷ 200 = 60%
- Passives: 50 ÷ 200 = 25%
- Detractors: 30 ÷ 200 = 15%
Step 3: Apply the formula
NPS = 60% - 15% = 45
Your Net Promoter Score is 45.
Quick tip: NPS scores range from -100 (everyone is a detractor) to +100 (everyone is a promoter). Any positive score is generally considered good, though this varies by industry.
Common calculation mistakes to avoid
Mistake #1: Including Passives in the calculation
Passives should be counted in your total respondents but not added or subtracted from your NPS. They're neutral.
Mistake #2: Using the wrong rating scale
NPS must use a 0-10 scale. Don't convert from 1-5 star ratings or other scales—the categories won't align correctly.
Mistake #3: Miscategorizing scores
Remember: 0-6 are Detractors, 7-8 are Passives, and 9-10 are Promoters. An 8 is not a Promoter—it's a Passive.
Mistake #4: Rounding before calculating
Calculate percentages to at least one decimal place before subtracting to maintain accuracy.
Understanding your NPS score: benchmarks and context
A score of 45 might be excellent for one industry and mediocre for another. Context matters.
General NPS benchmarks
- Above 70: World-class, excellent customer loyalty
- 50-70: Very good, strong customer relationships
- 30-50: Good, room for improvement
- 0-30: Needs improvement, focus on experience
- Below 0: Critical issues, immediate action required
NPS benchmarks by industry (2025)
Industry averages vary significantly:
- SaaS/Software: 30-40 (B2B), 20-30 (B2C)
- E-commerce: 45-60
- Financial services: 30-40
- Healthcare: 35-45
- Telecommunications: 25-35
- Airlines: 35-50
- Retail: 50-60
- Hospitality: 40-55
Compare your score against your industry average, not general benchmarks. A score of 35 in telecommunications might be excellent, while the same score in e-commerce suggests significant room for improvement.
Important context: Your NPS trend over time is more valuable than any single score. Focus on continuous improvement rather than hitting arbitrary benchmarks.
What influences NPS scores
Several factors affect what's considered a "good" NPS:
- Industry dynamics: Monopolistic industries (like cable providers) naturally have lower scores
- Product complexity: Simple products often score higher than complex enterprise software
- Customer acquisition: Self-service products may score differently than high-touch sales
- Market maturity: Established products face different expectations than new innovations
- Cultural factors: Different regions have different rating tendencies (more on this below)
When and how to collect NPS data
Timing your NPS surveys correctly is critical for getting accurate, actionable data.
Two types of NPS surveys
1. Relationship NPS (periodic surveys)
Measures overall sentiment at regular intervals:
- When: Quarterly or bi-annually
- Who: All active customers
- Purpose: Track loyalty trends over time
- Best for: Strategic decision-making and long-term tracking
2. Transactional NPS (event-triggered)
Measures satisfaction after specific interactions:
- When: After purchase, support interaction, onboarding, renewal
- Who: Customers who just had that experience
- Purpose: Identify friction points in specific workflows
- Best for: Tactical improvements to processes and touchpoints
Optimal timing for different products
SaaS products:
- 7 days after signup (initial impression)
- 30 days after signup (onboarding complete)
- At renewal time (loyalty check)
- After support interactions
E-commerce:
- 7-10 days after delivery (product received and used)
- After returns or customer service interactions
- Quarterly for repeat customers
Service businesses:
- Immediately after service completion
- 1 week later (reflection period)
- Quarterly for ongoing clients
Best practices for NPS surveys
Keep it simple:
- Lead with the NPS question (0-10 scale)
- Follow up with ONE open-ended question: "What's the primary reason for your score?"
- Optional: One additional question based on their category (promoter, passive, detractor)
Make it easy to respond:
- Use embedded NPS surveys that appear contextually on your site or in your app
- Mobile-optimize everything—many users respond on phones
- Allow anonymous responses to encourage honesty
- Keep total completion time under 60 seconds
Set the right context:
- Be specific about what you're asking (the product, the service, the company)
- Ask at a moment when the experience is fresh
- Don't survey too frequently (maximum once per quarter per customer)
Pro tip: Use Ask Users to create NPS surveys with automatic categorization, real-time analytics, and built-in follow-up questions that adapt based on the score given.
The follow-up question: extracting actionable insights
The NPS score tells you how customers feel. The follow-up question tells you why—and that's where the real value lives.
The essential follow-up question
"What's the primary reason for your score?"
This open-ended question works for all three categories and provides the context you need to take action.
Category-specific follow-up questions
For even more targeted insights, ask different follow-ups based on the score:
For Promoters (9-10):
- "What do you value most about [product]?"
- "What could make your experience even better?"
- "Would you be willing to share your experience in a case study or testimonial?"
For Passives (7-8):
- "What's preventing you from rating us higher?"
- "What one thing would make you more likely to recommend us?"
- "How does our product compare to alternatives you've considered?"
For Detractors (0-6):
- "We're sorry to hear that. What specifically disappointed you?"
- "What would we need to change for you to recommend us?"
- "Would you be open to a brief call to discuss your experience?"
Analyzing qualitative feedback
The text responses are gold. Here's how to mine them:
1. Tag common themes:
- Create categories like "pricing," "features," "support," "ease of use," "reliability"
- Tag each response with relevant themes
- Track which themes appear most frequently for each category
2. Look for patterns:
- What do Promoters consistently mention? (Your strengths)
- What frustrates Detractors most often? (Your urgent priorities)
- What would convert Passives to Promoters? (Your opportunities)
3. Prioritize by impact:
- Calculate how many detractors mention each issue
- Estimate how many could become Passives or Promoters if resolved
- Focus on changes that could shift the most customers up the scale
How to improve your NPS score: proven strategies
Now for the most important part: turning insights into improvements.
Strategy 1: Fix what's driving detractors
This is your highest-ROI opportunity. Converting detractors to passives (or even promoters) has double impact: reducing negatives while increasing your score.
Action steps:
- Identify the top 3 complaints from detractors
- Create dedicated task forces for each issue
- Set 30-60-90 day improvement targets
- Follow up with detractors after implementing fixes
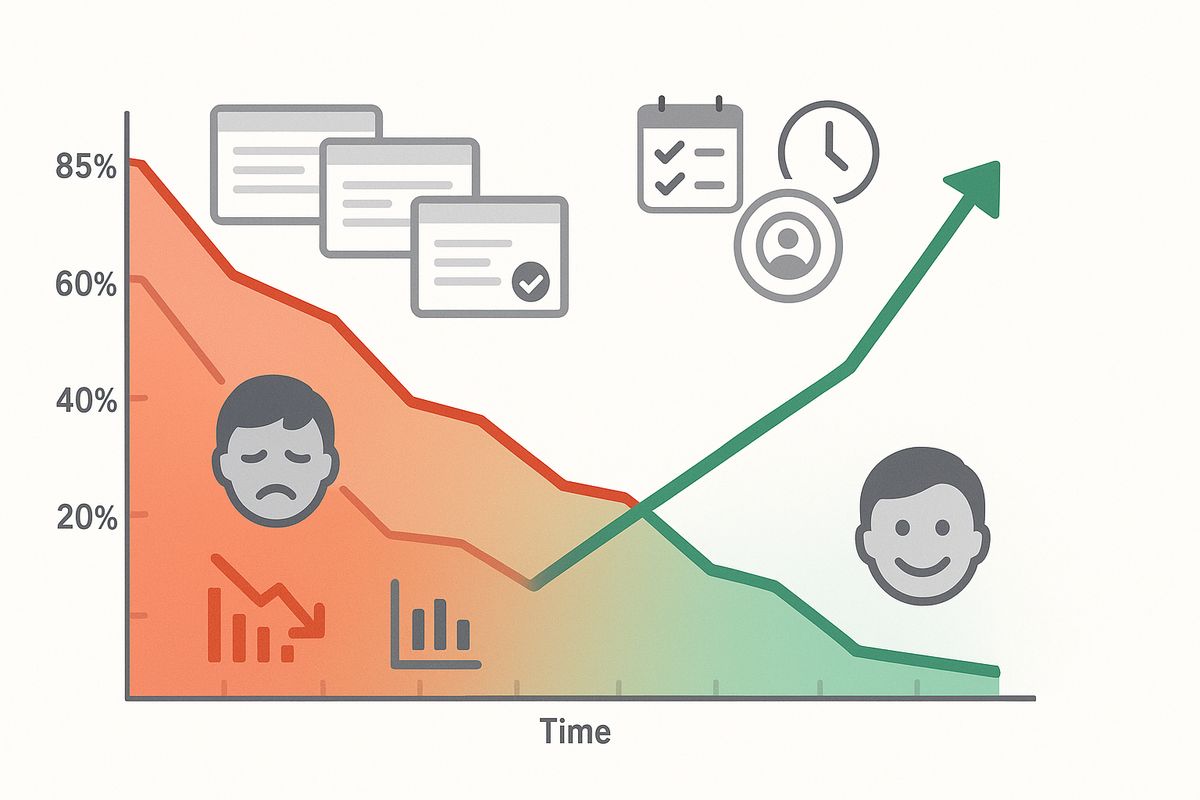
Real example: A SaaS company discovered 60% of detractors cited "confusing onboarding" as their primary frustration. They redesigned their first-use experience with an interactive tutorial. Three months later, their NPS improved from 28 to 41—a 13-point increase.
Strategy 2: Convert passives to promoters
Passives are already satisfied but not enthusiastic. They're the easiest group to move up with focused improvements.
What passives typically want:
- That one missing feature that would make your product complete for them
- Faster support response times
- Better integration with their existing tools
- More personalized experience
- Improved performance or reliability
Action steps:
- Analyze passive feedback to identify the most common "missing piece"
- Survey passives specifically: "What would make this a 9 or 10 for you?"
- Prioritize quick wins that address multiple passive concerns
- Communicate improvements directly to passives who mentioned them
Strategy 3: Amplify what promoters love
Your promoters tell you what's working. Do more of that.
Action steps:
- Identify patterns in promoter feedback
- Double down on features and experiences they value most
- Make these strengths more visible to new customers
- Use promoter testimonials in marketing (with permission)
- Ask promoters for referrals or reviews
Opportunity: Promoters are your best growth channel. Make it easy for them to refer others with shareable links, referral incentives, or integration with their workflows.
Strategy 4: Close the feedback loop
One of the most powerful ways to improve NPS is showing customers you're listening.
The feedback loop process:
- Acknowledge: Send a personal response to every detractor (and consider reaching out to passives)
- Investigate: For critical issues, schedule calls to understand the full context
- Act: Make changes based on feedback
- Communicate: Tell respondents what you changed because of their input
- Re-survey: After implementing improvements, ask those customers for updated feedback
When customers see their feedback lead to real changes, they become more engaged and more likely to recommend you—even if they were initially detractors.
Strategy 5: Improve at critical touchpoints
Use transactional NPS data to identify and fix friction at key moments:
Onboarding:
- Survey after first use and after 30 days
- Track NPS changes between these points
- If it drops, your onboarding has issues
- Use embedded surveys to collect feedback at specific onboarding steps
Customer support:
- Survey immediately after support interactions
- Track by support agent, channel, and issue type
- Identify training opportunities
- Reward agents with consistently high NPS
Renewals and upgrades:
- Survey before and after renewal decisions
- Understand what drives renewal satisfaction
- Identify upsell opportunities from happy customers
Strategy 6: Segment and personalize
Not all customers should have the same experience. Segment your NPS data by:
- Customer tier: Enterprise vs. SMB vs. individual
- Product usage: Power users vs. occasional users
- Industry: Different verticals have different needs
- Geography: Regional preferences and cultural factors
- Customer journey stage: New vs. established customers
Then tailor improvements and communication to each segment's specific pain points and preferences.
Strategy 7: Make it cultural
The most successful companies make customer loyalty everyone's responsibility.
Share NPS widely:
- Display current NPS prominently in your office or dashboards
- Share verbatim customer feedback at all-hands meetings
- Celebrate improvements and learn from declines as a team
Tie it to goals:
- Include NPS improvement in team objectives
- Reward departments that move their segment scores up
- Make customer satisfaction a hiring criterion
Enable everyone to impact it:
- Give all teams access to customer feedback
- Create processes for any employee to report customer issues
- Empower front-line staff to solve problems without approvals
Regional and cultural considerations
NPS scores vary significantly across cultures due to different rating tendencies.
Regional scoring patterns
- North America and Western Europe: Tend to rate more extremely (lots of 9-10s and 0-6s)
- Japan and South Korea: More conservative raters, fewer 9-10 scores even when satisfied
- Latin America: Generally more generous with high scores
- Middle East: Culturally avoid giving extremely low scores
If you operate globally, consider:
- Calculating separate NPS by region rather than a global average
- Comparing regional scores to regional benchmarks
- Focusing on trend lines within each region rather than absolute scores
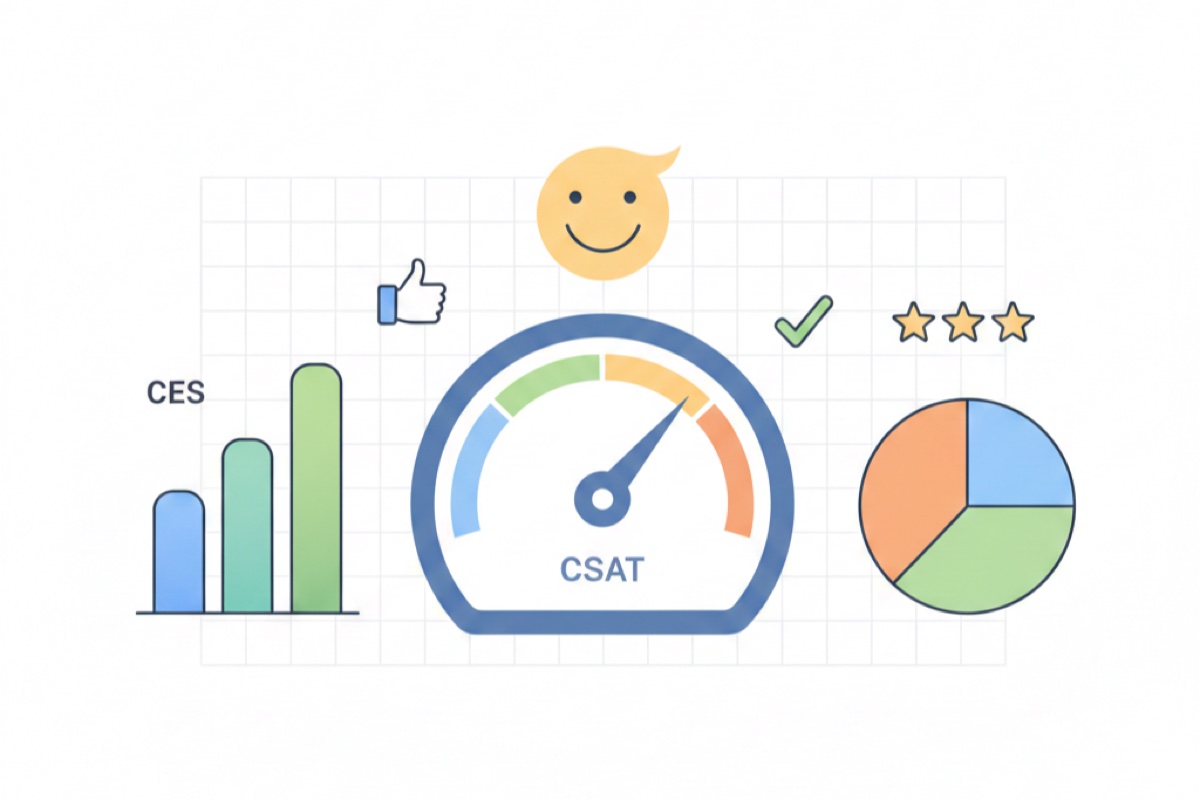
- Using complementary metrics (CSAT, CES) to validate NPS findings
Common NPS pitfalls and how to avoid them
Pitfall #1: Survey fatigue
The problem: Over-surveying customers leads to declining response rates and survey bias (only very happy or very unhappy customers respond).
The fix:
- Limit NPS surveys to once per quarter for relationship NPS
- For transactional NPS, survey after major touchpoints only
- Never survey the same customer within 60 days unless absolutely necessary
- Track response rates—if they drop below 20%, you're over-surveying
Pitfall #2: Not acting on feedback
The problem: Collecting NPS data but not making changes based on it. This frustrates customers and makes future surveys less effective.
The fix:
- Create a monthly review process for NPS feedback
- Assign ownership for each major theme identified
- Set concrete improvement targets and deadlines
- Communicate changes back to customers who requested them
Pitfall #3: Gaming the score
The problem: Optimizing for the score rather than actual customer satisfaction (e.g., only surveying your happiest customers, coaching customers to give high scores).
The fix:
- Survey a representative sample of all customer segments
- Never incentivize high scores
- Keep surveys anonymous when possible
- Value trend improvement over absolute numbers
Pitfall #4: Ignoring the "why"
The problem: Focusing only on the number without understanding the drivers.
The fix:
- Always include the follow-up "why" question
- Read every piece of qualitative feedback
- Do periodic customer interviews with each category
- Track themes over time, not just the score
Pitfall #5: Comparing apples to oranges
The problem: Comparing your score to companies in different industries or with different business models.
The fix:
- Benchmark against your industry specifically
- Focus primarily on your own trend over time
- Compare segment-to-segment within your company
- Remember: improving from 25 to 35 is more meaningful than hitting 50
Complementary metrics to track alongside NPS
NPS is powerful but shouldn't be your only metric. Use these alongside it for a complete picture:
Customer Satisfaction Score (CSAT)
What it measures: Satisfaction with a specific interaction or feature
When to use: After support interactions, feature releases, or specific transactions
How it complements NPS: More tactical, tells you about specific moments rather than overall loyalty
Customer Effort Score (CES)
What it measures: How easy it was to accomplish a task
When to use: After onboarding, checkout, support resolution, or any complex workflow
How it complements NPS: Friction drives detractors—CES helps identify where customers struggle
Churn rate
What it measures: Percentage of customers who cancel or don't renew
When to use: Monthly or quarterly monitoring
How it complements NPS: Validates NPS findings—detractors should correlate with higher churn
Revenue retention and expansion
What it measures: Revenue retained from existing customers and upsells
When to use: Monthly and annual tracking
How it complements NPS: Promoters should drive expansion revenue through upsells and referrals
The connection: NPS is a leading indicator while churn and revenue are lagging indicators. High NPS today should predict lower churn and higher expansion tomorrow.
Building an NPS program with Ask Users
Ask Users provides everything you need to measure, track, and improve your Net Promoter Score—all in one platform.
Complete NPS solution
With Ask Users, you can:
- Create NPS surveys in minutes: Use pre-built NPS templates to get started quickly
- Embed anywhere: Add NPS surveys to your website, app, or share via link—works everywhere
- Automatic calculation: Your NPS score is calculated in real-time as responses come in
- Collect qualitative feedback: Add follow-up questions to understand the "why" behind each score
- Track responses: Monitor your NPS responses with built-in analytics and reporting
- Label and organize: Tag responses to identify patterns and themes in feedback
- Close the loop: Export responses with contact info to follow up with detractors
- Flexible distribution: Share via direct links, embed on your site, or integrate with your workflow
Why Ask Users for NPS
- No coding required: Create professional NPS surveys without technical setup
- Mobile-optimized: Perfect experience on any device, maximizing response rates
- Real-time dashboard: See your current NPS, trends, and distribution at a glance
- Privacy-focused: GDPR-compliant with anonymous response options
- Continuous collection: Run both relationship and transactional NPS from one platform
- Start free: Collect up to 25 NPS responses per month at no cost
Getting started with NPS surveys
- Create your NPS survey: Use our pre-built NPS template or build your own
- Add follow-up questions: Include the "why" question and any additional context questions
- Distribute your survey: Embed on your site, share via link, or send to your customer list
- Monitor responses: Review feedback in your dashboard and export data for analysis
- Track your progress: Calculate your NPS over time and measure improvement
Start collecting NPS data today—no credit card required for the free tier.
Your 90-day NPS improvement plan
Ready to improve your Net Promoter Score? Here's a practical roadmap:
Month 1: Establish baseline and understand drivers
- Week 1: Set up your NPS survey with Ask Users
- Week 2: Launch to all customers, aim for 100+ responses
- Week 3: Calculate initial NPS and analyze feedback by category
- Week 4: Identify top 3 detractor issues and top 3 passive requests
Month 2: Implement quick wins and close the loop
- Week 1: Personally respond to all detractors
- Week 2: Fix 1-2 quick issues mentioned by detractors
- Week 3: Implement one high-impact improvement for passives
- Week 4: Follow up with customers affected by changes
Month 3: Expand program and measure progress
- Week 1: Launch transactional NPS at key touchpoints
- Week 2: Re-survey relationship NPS to measure improvement
- Week 3: Share results company-wide and celebrate wins
- Week 4: Build roadmap for next quarter's improvements
Frequently asked questions
What's a good NPS score?
Any positive score (above 0) means you have more promoters than detractors, which is good. However, context matters:
- Above 50 is excellent in most industries
- 30-50 is good with room to improve
- 0-30 needs attention
- Below 0 requires immediate action
Always compare to your industry benchmark and focus on improving your trend over time.
How many responses do I need for accurate NPS?
For statistical significance, aim for at least 100 responses. However, even 30-50 responses can provide valuable directional insights. The key is ensuring your sample represents your overall customer base (not just happy or unhappy customers).
Should I survey all customers or a sample?
For most businesses, surveying all customers quarterly is fine. If you have more than 10,000 customers, a representative random sample (at least 400-500 customers) works well. For transactional NPS, survey everyone who goes through that touchpoint.
How often should I measure NPS?
For relationship NPS, quarterly is ideal for most businesses. Monthly can work for fast-growing companies with rapid changes. Less than quarterly makes it hard to track improvements. For transactional NPS, survey after each relevant event.
What if my response rate is low?
Response rates below 10% suggest issues with your survey approach. Try:
- Timing the survey better (not during busy periods)
- Personalizing the survey invitation
- Explaining how you'll use the feedback
- Making the survey mobile-friendly
- Using embedded surveys that appear contextually rather than relying only on email
Can I incentivize customers to complete NPS surveys?
You can offer incentives for completing the survey (e.g., entry into a prize draw), but never incentivize specific scores. Incentivizing high scores destroys the validity of your data. Also, make clear that incentive eligibility doesn't depend on their rating.
What's the difference between NPS and customer satisfaction (CSAT)?
NPS measures loyalty and likelihood to recommend (future-oriented), while CSAT measures satisfaction with a specific interaction (past-oriented). NPS predicts growth and retention; CSAT helps you improve specific experiences. Use both for a complete picture.
How do I get executives to care about NPS?
Connect NPS to business outcomes:
- Show correlation between NPS and revenue retention
- Calculate the lifetime value difference between promoters and detractors
- Demonstrate how competitors' NPS relates to their market share
- Share specific customer quotes that illustrate business risks or opportunities
Final thoughts
Net Promoter Score is a powerful tool for measuring and improving customer loyalty, but only if you use it correctly. Calculate it accurately, understand what drives it, act on the insights, and track your progress over time.
Remember: the score itself is just a number. The real value comes from the conversations it starts, the priorities it reveals, and the improvements it drives. A company with an NPS of 35 that's actively listening and improving is better positioned than one with an NPS of 50 that's complacent.
Start measuring your NPS today, close the feedback loop with every customer who responds, and commit to systematic improvement. Your customers will notice, your team will rally around it, and your business will grow because of it.
Start measuring your NPS today
Ask Users makes it easy to create NPS surveys, automatically calculate your score, and track improvements over time. Set up your first survey in minutes.