Survey fatigue is killing your response rates. The average email survey response rate has dropped from 33% in 2010 to just 16% today. The culprit? Over-surveying. Companies bombard users with feedback requests, causing respondents to tune out, rush through answers, or ignore surveys entirely.
The paradox of feedback collection: the more you ask, the less you get. But user insights remain crucial for product development, so how do you gather feedback without exhausting your audience?
In this guide, you'll learn the psychological principles behind survey fatigue, discover smart sampling strategies that maximize data quality while minimizing user burden, and implement proven techniques to boost response rates without annoying your users.
Understanding survey fatigue: why users stop responding
Survey fatigue isn't just about receiving too many surveys—it's a complex psychological phenomenon influenced by frequency, length, relevance, and timing.
The three types of survey fatigue
1. Survey-taking fatigue (within-survey):
Users grow tired while taking a single survey. This happens when surveys are too long, repetitive, or cognitively demanding.
Symptoms:
- Straight-lining (selecting the same answer repeatedly without reading)
- Speeding (rushing through without thoughtful consideration)
- Abandonment mid-survey
- Declining answer quality toward the end
- Random or nonsensical open-text responses
2. Survey response fatigue (across surveys):
Users become exhausted from being surveyed too frequently by the same organization.
Symptoms:
- Declining response rates over time
- Increased survey ignoring or immediate deletion
- Lower completion rates even for short surveys
- Negative sentiment in open responses ("Why do you keep asking me this?")
3. General survey fatigue (population-level):
Society-wide phenomenon where people are over-surveyed by all organizations, making everyone less willing to respond to any survey.
Impact: Average email survey response rates dropped from 33% (2010) to 16% (2024). In-app surveys fare better at 30-40% but are trending downward.
The cost of fatigue: Companies that survey users more than once per month see 35-50% lower response rates compared to those surveying quarterly, according to research from Qualtrics and Forrester.
The psychology behind survey fatigue
Cognitive load and attention economics
Every survey request competes for limited cognitive resources. Users perform mental cost-benefit calculations: "Is the value of providing feedback worth my time and mental effort?"
Factors increasing perceived cost:
- Survey length (real or perceived)
- Complexity of questions
- Bad timing (mid-task interruption)
- Unclear relevance ("Why does this matter?")
- No visible outcomes from previous surveys
Factors increasing perceived value:
- Clear purpose and relevance
- Evidence of past survey impact ("We built X because you asked")
- Incentives (tangible or psychological)
- Convenient timing
- Personal benefit ("Help us improve your experience")
Reciprocity and fairness
Users feel a survey relationship should be reciprocal. If they invest time providing feedback but never see results or acknowledgment, they feel used.
Breaking reciprocity leads to:
- Declining trust in the organization
- Lower response rates
- Lower quality responses (less effort invested)
- Negative word-of-mouth
Maintaining reciprocity:
- Thank respondents genuinely
- Share what you learned from surveys
- Show actions taken based on feedback
- Offer tangible value (incentives, early access, exclusive insights)
Reactance and autonomy
People resist feeling controlled or manipulated. Poorly timed, mandatory, or overly frequent surveys trigger psychological reactance—a negative emotional response to perceived freedom restriction.
Survey triggers that cause reactance:
- Forcing surveys to access features ("Take this survey to continue")
- Impossible-to-close survey popups
- Surveys immediately after signup (before value experienced)
- Vague or manipulative questioning
- Excessive personal questions without clear justification
Smart sampling: survey the right people at the right time
You don't need to survey everyone, every time. Strategic sampling maintains response quality while reducing burden.
Random sampling strategies
Simple random sampling:
Survey a random subset of users instead of everyone. Example: Survey 20% of monthly active users rather than 100%.
Benefits:
- Statistically representative data
- Reduces per-user survey frequency by 80%
- Maintains long-term willingness to respond
- Lower costs and faster data processing
Sample size guidance:
- 10,000+ users: Survey 5-10% for reliable insights
- 1,000-10,000 users: Survey 15-25%
- 100-1,000 users: Survey 30-50%
- <100 users: Consider surveying all, but reduce frequency
Stratified sampling for targeted insights
Divide users into segments and sample from each segment to ensure representation across key groups.
Common stratification variables:
- User tenure: New users (0-30 days), active users (30-365 days), long-term users (365+ days)
- Engagement level: Power users, regular users, infrequent users
- Plan type: Free, basic paid, premium
- Use case: Different product features or workflows
Example: Survey 100 users total: 30 power users, 50 regular users, 20 infrequent users—ensuring you hear from all segments despite differences in population size.
Event-triggered sampling
Survey users after specific actions or milestones when feedback is most relevant and fresh.
High-value trigger events:
- Post-purchase: 3-5 days after transaction
- Feature usage: After using a new feature 3+ times
- Support resolution: Immediately after ticket closure
- Milestone completion: Completing onboarding, hitting usage goals
- Subscription changes: Upgrades, downgrades, cancellations
Throttling event triggers: Don't survey the same user for multiple events in short periods. Example: Max one event-triggered survey per user per 30 days.
Rotation and cooldown periods
Implement mandatory waiting periods between surveys for individual users.
Recommended cooldown periods:
- In-app micro-surveys: 2-4 weeks minimum between surveys
- Email surveys: 4-8 weeks minimum
- Lengthy surveys (10+ questions): 12+ weeks minimum
- Research interviews: 3-6 months minimum
Rotation systems: If you need monthly feedback, survey different user cohorts each month rather than the same users repeatedly.
Impact data: Companies implementing strict cooldown periods (60+ days) see 40-60% higher response rates than those surveying users monthly or more frequently.
Optimal survey timing: when to ask matters
Even perfect surveys fail if timed poorly. Context and user state dramatically impact response likelihood and quality.
Timing within user sessions
Best times to trigger in-app surveys:
1. After task completion:
- User just achieved a goal (completed onboarding, finished project)
- Positive emotional state increases cooperation
- Fresh experience means accurate, detailed feedback
- Example: "How was your experience creating your first form?"
2. During idle moments:
- User pauses or appears inactive for 30+ seconds
- Not interrupting active workflow
- Good for general satisfaction or feature requests
3. Before exit (exit-intent):
- User moving toward logout or closing browser
- Last chance to gather session feedback
- Keep extremely short (1-2 questions)
Worst times to trigger surveys:
- ❌ Immediately after login (let users accomplish something first)
- ❌ Mid-task or mid-flow (interruption causes frustration and abandonment)
- ❌ During error states or when users are clearly struggling
- ❌ First few interactions with product (insufficient experience to provide useful feedback)
Day and time optimization
Email survey best send times:
- B2B users: Tuesday-Thursday, 10am-2pm (local timezone)
- B2C users: Weekend mornings or weekday evenings (7-9pm)
- Avoid: Monday mornings (inbox overload), Friday afternoons (weekend mindset)
In-app survey day patterns:
- Weekday surveys typically see higher quality responses (users less rushed)
- Weekend surveys may see higher quantity for consumer products
- Test your audience—patterns vary by product type and user demographics
Lifecycle timing
Survey users at natural feedback moments in their customer journey:
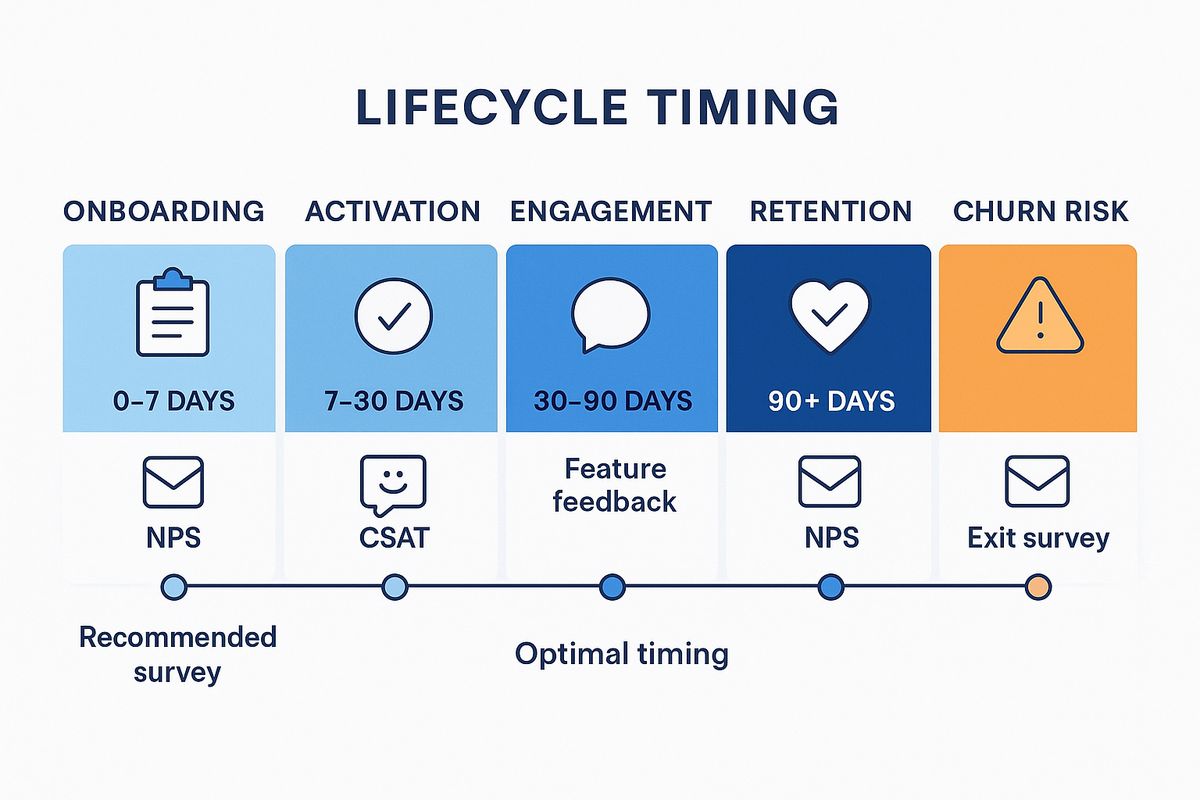
Onboarding stage (0-7 days):
- Wait until user experiences core value
- Focus: Onboarding clarity, first impressions
- Keep very short (1-3 questions)
Activation stage (7-30 days):
- User has adopted key features
- Focus: Feature usability, needs assessment
- Good time for slightly longer surveys (5-7 questions)
Engagement stage (30-90 days):
- Established usage patterns
- Focus: Feature requests, satisfaction, competitive comparison
- Can include NPS here
Retention stage (90+ days):
- Long-term user with deep product knowledge
- Focus: Product direction, advanced features, strategic feedback
- Good candidates for longer research surveys or interviews
At-risk/Churn stage:
- Declining usage, cancellation attempt, or negative signals
- Focus: Reasons for dissatisfaction, what could change mind
- Critical opportunity—prioritize over cooldown periods
Survey length and structure optimization
The short is better principle
Survey length vs completion rates:
- 1-3 questions: 80-90% completion rate
- 4-7 questions: 60-75% completion rate
- 8-15 questions: 40-55% completion rate
- 16+ questions: 20-35% completion rate
Every additional question costs you respondents. Is the marginal value of question #12 worth losing 30% of your respondents?
Ruthless prioritization: Force yourself to cut 50% of questions in your first draft. If you can't identify which half to cut, your survey isn't focused enough.
Micro-surveys: the fatigue antidote
Micro-surveys (1-2 questions) combat fatigue through minimal burden and high contextual relevance.
Micro-survey formats:
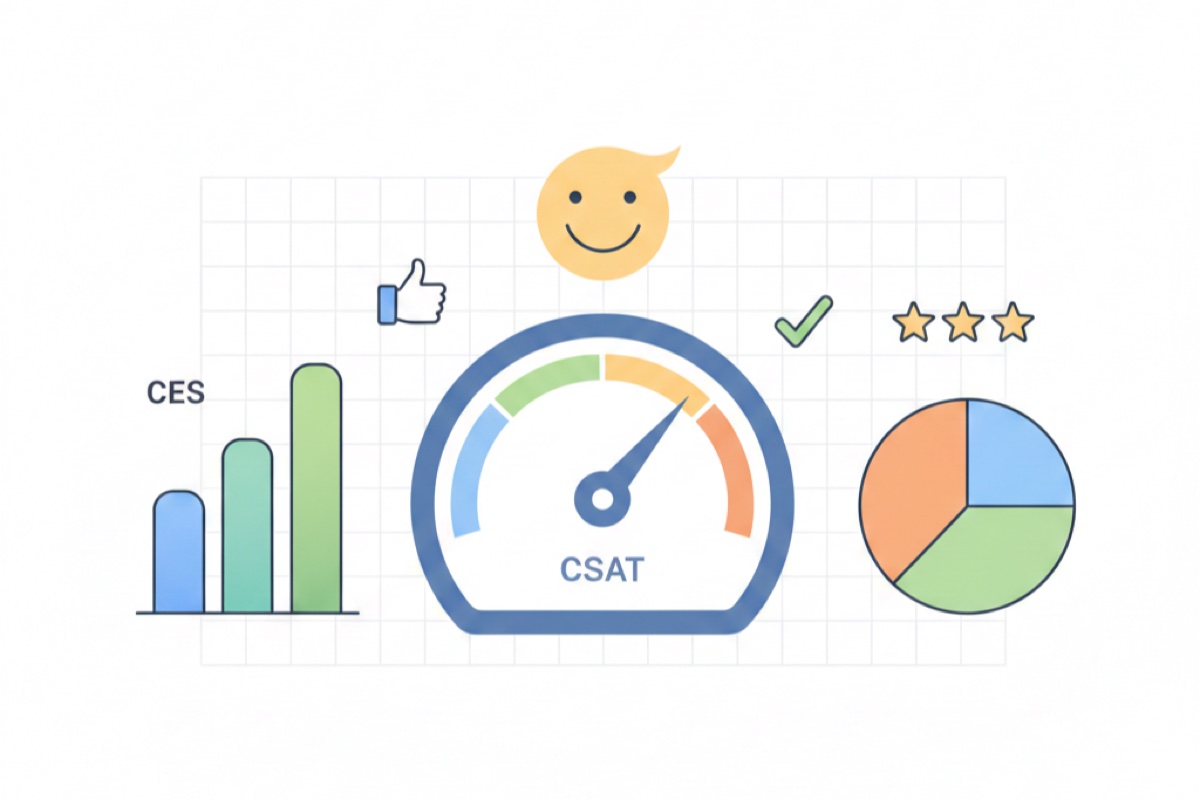
1. Single-question NPS or CSAT:
"How likely are you to recommend [Product] to a colleague?" (0-10 scale)
2. Binary choice with optional follow-up:
"Did you find what you were looking for?" Yes / No
[If No] "What were you looking for?" (text field)
3. Feature-specific feedback:
"How useful was [Feature] for your task?" (5-star rating)
"Any suggestions?" (optional text)
4. Quick sentiment check:
"How are you feeling about your experience today?" 😞 😐 🙂 😄
Benefits of micro-surveys:
- 90%+ completion rates (vs 40-60% for longer surveys)
- Higher quality responses (less respondent fatigue)
- Less intrusive (respects user time)
- Can survey more frequently without causing fatigue
- Contextually relevant (tied to specific moments)
Question ordering psychology
When surveys must be longer, question order significantly impacts completion and quality.
Optimal question sequence:
- Hook with easy, engaging question: Start with something interesting and easy to answer. Builds momentum.
- Core questions in the middle: Place most important questions 2-4 in the sequence when attention is high.
- Sensitive/demographic questions last: Age, income, personal info—save for end after trust is established.
- Open-text questions toward end: Require most cognitive effort, so place after simpler questions.
- End with positive question if possible: Leave respondents with good feeling ("What do you love most about [Product]?")
Avoid:
- Leading with demographics (boring, feels invasive)
- Clustering all rating scales together (creates mindless pattern responses)
- Asking similar questions repeatedly (screams "we don't respect your time")
Incentives: when and how to reward responses
Incentives increase response rates but can affect data quality. Use strategically.
Monetary incentives
Gift cards or direct payment:
- Pros: Significantly boost response rates (15-30% increase), attract reluctant respondents
- Cons: Attract incentive-chasers who rush through for reward, costly at scale
- Best for: Long surveys (15+ minutes), research interviews, hard-to-reach populations
Incentive strategies:
- Guaranteed small incentive: $2-5 gift card for everyone who completes (predictable cost, fair)
- Lottery/raffle: Enter to win $100 gift card (lower cost, gamification appeal)
- Tiered incentives: Longer/more valuable surveys get higher incentives
Implementation tips:
- Announce incentive upfront to maximize participation
- Auto-deliver incentives within 24 hours (manual delivery causes frustration)
- Include quality checks to prevent gaming (attention checks, minimum time thresholds)
Non-monetary incentives
Product value incentives:
- Early access to new features
- Extended trial periods
- Free premium feature for a month
- Unlocked content or resources
- Priority support access
Psychological incentives:
- Impact visibility: "Your feedback shapes our roadmap—see what we built based on last survey"
- Exclusive insights: "Get the survey results report showing what other users think"
- Recognition: "Join our product advisory board" (limited spots)
- Contribution pride: "You're helping thousands of users by improving [Product]"
When not to incentivize:
- Quick micro-surveys (1-2 questions)—incentive creates friction
- Transactional surveys (post-purchase, support)—timing is motivation
- When you need only highly engaged users' opinions
Data quality tip: Non-monetary incentives (early access, insights) attract intrinsically motivated users who provide higher quality feedback than monetary incentives alone.
Building a survey governance framework
Prevent fatigue by establishing organization-wide survey policies.
Survey request management
Centralized survey calendar:
- All teams log planned surveys in shared calendar
- Shows which users are being surveyed when
- Prevents collisions and over-surveying
- Enables cross-team coordination
User contact limits:
- Max surveys per user per quarter: 2-3 surveys
- Max surveys per user per year: 6-8 surveys
- Enforce through technical controls (survey platform rules)
- Track across all survey types (email, in-app, phone)
Survey approval process
Required justification:
Teams requesting surveys must answer:
- What decision will this survey inform?
- Why do we need new data? (Can existing data answer this?)
- What's the minimum viable sample size?
- Can this be a micro-survey instead?
- When was this audience last surveyed?
Prioritization criteria:
When multiple teams want to survey simultaneously, prioritize:
- Critical business decisions (launch/no-launch, major pivots)
- Time-sensitive research (competitive responses, crisis situations)
- Longitudinal tracking studies (NPS, satisfaction benchmarks)
- Nice-to-have feature validation
Quality standards
Survey review checklist:
- ☐ Survey length is under 10 questions (or strong justification for longer)
- ☐ Questions are clear, unbiased, and actionable
- ☐ No leading or loaded questions
- ☐ Audience is appropriate and not over-surveyed
- ☐ Timing is optimal for target users
- ☐ Mobile-optimized if in-app or email
- ☐ Clear intro explaining purpose and estimated time
- ☐ Privacy policy and data usage explained
Measuring and combating fatigue
Survey health metrics to track
Response rate trends:
- Overall response rate by survey type
- Response rate by user segment
- Trends over time (declining = fatigue warning)
- Benchmark: 30%+ for in-app, 15%+ for email
Completion rates:
- Percentage of started surveys completed
- Drop-off points (which questions lose people?)
- Benchmark: 70%+ for well-designed surveys
Time to complete:
- Average time spent on survey
- Speeders (completed unusually fast—likely low quality)
- Benchmark: Should match estimated time; significant deviations indicate issues
Response quality indicators:
- Straight-lining frequency (same answer for all questions)
- Open-text response length and substance
- Failed attention checks
- Conflicting answer patterns
Sentiment in feedback:
- Complaints about survey frequency in open text
- Negative comments about survey length or relevance
- Explicit "stop surveying me" requests
Fatigue warning signs
Early warning indicators:
- Response rates declining 10%+ quarter over quarter
- Completion rates dropping below 60%
- Increasing percentage of straight-lining responses
- Shorter open-text responses over time
- More negative sentiment in feedback
Critical fatigue signs:
- Response rates below 15% for surveys that previously got 30%+
- Multiple users explicitly requesting to opt out of surveys
- High percentage of sarcastic or hostile open-text responses
- Survey unsubscribe rates spiking
Recovery strategies
If you've over-surveyed your audience, recovery is possible but requires discipline:
1. Immediate moratorium:
- Pause all non-critical surveys for 60-90 days
- Give users' attention a rest
- Use existing data or alternative research methods
2. Audit and apologize:
- Acknowledge over-surveying in next communication
- Explain new approach: less frequent, more impactful
- Show what you learned from past surveys
3. Implement strict governance:
- Enforce cooldown periods
- Centralize survey approval
- Default to micro-surveys
- Rotate survey audiences
4. Rebuild trust:
- Share survey results and actions taken
- Close feedback loops publicly
- Make next surveys exceptionally relevant and brief
Recovery timeline: Expect 3-6 months to rebuild response rates after severe fatigue. Small improvements should appear in 1-2 months with disciplined approach.
Alternative feedback methods to reduce survey burden
Surveys aren't the only way to gather insights. Diversify your feedback methods to reduce survey dependency.
Passive feedback collection
In-app feedback widgets:
- Always-available but non-intrusive feedback buttons
- Users opt in when they have something to say
- Captures spontaneous feedback at point of need
- Lower response volume but higher signal quality
Support ticket mining:
- Analyze customer support conversations for themes
- No additional user burden—they're already contacting you
- Reveals pain points and feature requests organically
Session replay and analytics:
- Behavioral data shows what users do, not just what they say
- Identify friction points without asking
- Complement survey data with observational insights
User interviews and focus groups
When to use:
- Deep exploration of complex topics
- Understanding "why" behind quantitative survey data
- Testing concepts or prototypes
- Building empathy and user understanding
Advantages over surveys:
- Richer, more nuanced insights
- Can probe and ask follow-up questions
- Builds stronger user relationships
- Less feeling of "burden" when done right (users enjoy sharing expertise)
Community and beta programs
Power user councils:
- Small group (20-100 users) of engaged, invested users
- Willing to provide frequent feedback in exchange for influence
- Can survey more often without fatigue (they opted in for this)
- Supplement, don't replace, broader user feedback
Beta testing programs:
- Users explicitly sign up to test and provide feedback
- Expectation of feedback is built into the relationship
- Get detailed feature feedback without surveying general population
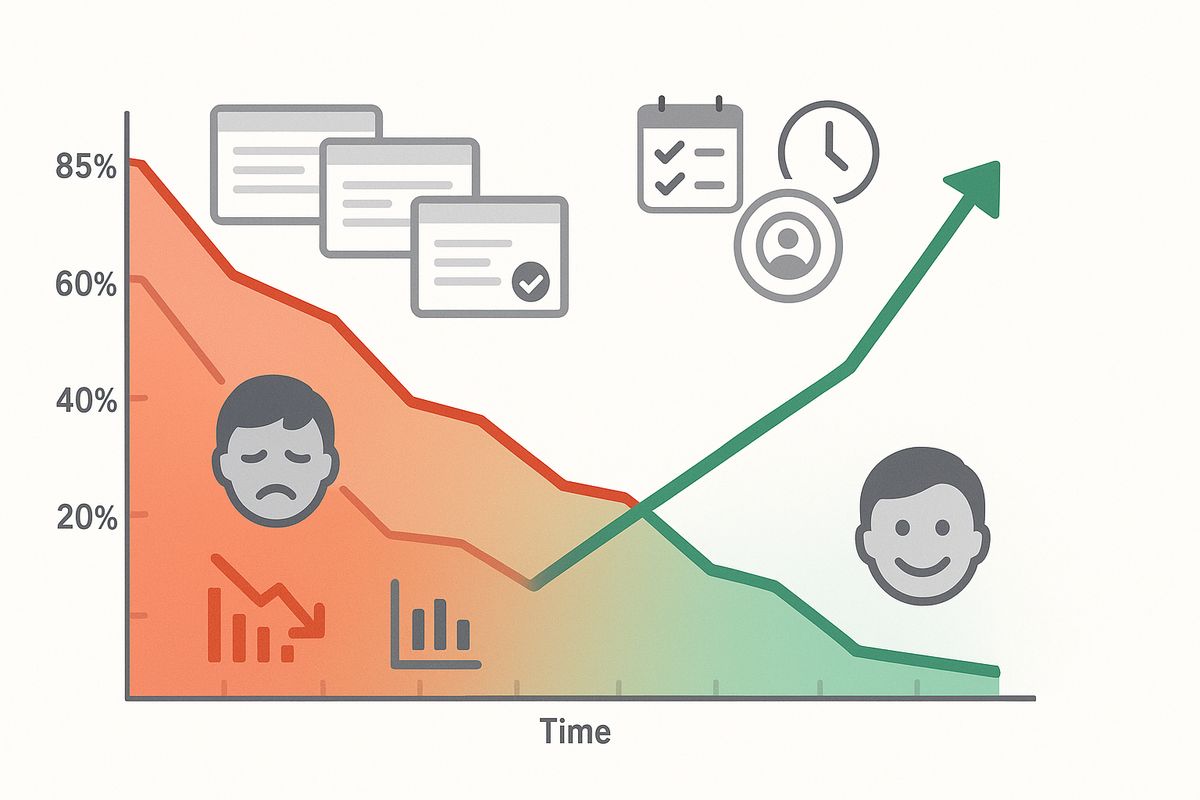
Case study: from 12% to 47% response rates
A B2B SaaS company struggled with declining survey response rates (from 38% to 12% over 18 months). Here's how they recovered:
Problems identified:
- Surveying same users every 2-3 weeks (various teams, no coordination)
- Average survey length: 22 questions
- No cooldown periods enforced
- Users never saw survey results or actions taken
- Generic survey invites with poor timing
Changes implemented:
Phase 1: Immediate actions (Month 1):
- 60-day survey moratorium (except critical churn surveys)
- Created centralized survey calendar
- Established max 1 survey per user per quarter policy
- Sent transparency email: "We know we over-surveyed you. We're changing."
Phase 2: New approach (Months 2-3):
- Converted 80% of planned surveys to micro-surveys (2-3 questions)
- Implemented random sampling (survey 15% of users, not 100%)
- Event-triggered surveys only (after key actions, not random timing)
- Created feedback loop blog showing quarterly summary: "You asked, we built"
Phase 3: Optimization (Months 4-6):
- A/B tested survey timing (found Tuesday 11am best for their audience)
- Added small non-monetary incentives (early feature access)
- Personalized survey invites based on user behavior
- Reduced longest survey from 22 to 9 questions
Results after 6 months:
- Response rate: 12% → 47% (+292% improvement)
- Completion rate: 54% → 83%
- Average response time: 8 minutes → 3 minutes
- Open-text response length: +65% (more detailed feedback)
- Survey complaints dropped to zero
- NPS improved by 8 points (users appreciated the change)
Key insight: Surveying 15% of users quarterly with well-timed micro-surveys generated more total useful feedback than surveying 100% of users monthly with long surveys.
Best practices summary: your anti-fatigue checklist
Use this checklist before launching any survey:
Before you survey
- ☐ Can existing data answer this question?
- ☐ Is this survey absolutely necessary right now?
- ☐ When was target audience last surveyed? (>60 days ago?)
- ☐ Can this be 3 questions instead of 10?
- ☐ Is a micro-survey sufficient?
- ☐ Are we surveying a sample or everyone? (sample is usually better)
- ☐ Is timing optimal for this audience?
Survey design
- ☐ Survey takes under 3 minutes to complete
- ☐ Purpose is clear in introduction
- ☐ Questions are unbiased and actionable
- ☐ Question order is logical and engaging
- ☐ Mobile-optimized and tested
- ☐ Thank you message explains next steps
After survey
- ☐ Analyze and share results within 2 weeks
- ☐ Identify actions based on feedback
- ☐ Close the loop with respondents (what we learned, what we're doing)
- ☐ Track response rate and quality metrics
- ☐ Schedule next survey opportunity (respecting cooldown)
Conclusion: respect attention, maximize insight
Survey fatigue isn't inevitable—it's the result of poor survey strategy. By respecting users' time and attention, you can maintain high response rates and data quality indefinitely.
Core principles to remember:
- Less is more: Fewer, better-timed surveys beat frequent, scattered surveys
- Quality over quantity: 100 thoughtful responses beat 1,000 rushed ones
- Reciprocity matters: Close the loop—show users their feedback creates change
- Sample strategically: You don't need to survey everyone, every time
- Default to micro-surveys: One question is often enough
- Respect autonomy: Make surveys optional and easy to dismiss
- Diversify methods: Surveys are one tool, not the only tool
The companies that excel at user feedback aren't those who survey most—they're those who survey smartest. Start by cutting your survey frequency in half and watch your response rates soar.
Collect feedback without the fatigue
AskUsers makes it easy to create micro-surveys and targeted feedback forms. Use our analytics to track response patterns and implement the survey strategies discussed in this guide to avoid over-surveying your users.