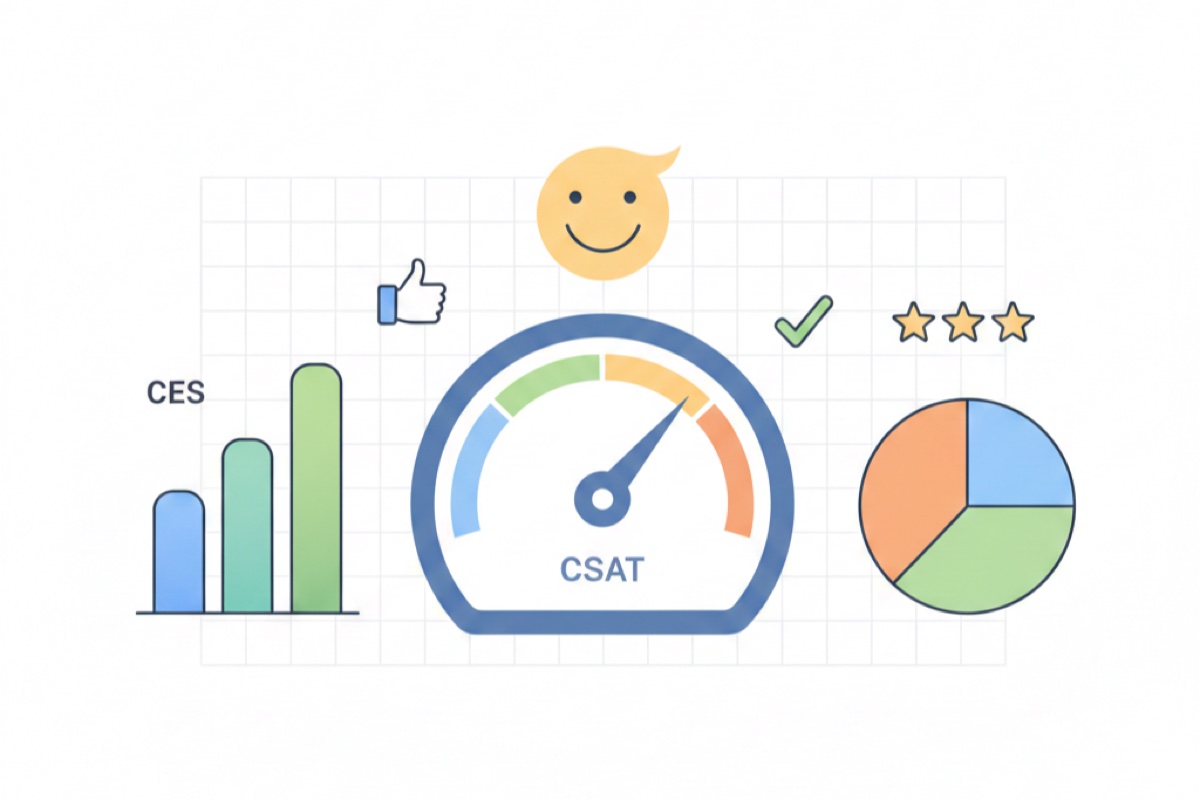
Customer satisfaction is the foundation of sustainable business growth. But "satisfaction" is an abstract concept until you put a number on it. Two of the most effective metrics for quantifying how customers feel about your product or service are the Customer Satisfaction Score (CSAT) and the Customer Effort Score (CES). Together with NPS, they form a powerful trio that reveals not just whether customers are happy, but why they stay, why they leave, and what you can do about it.
What is customer satisfaction and why it matters
Customer satisfaction measures how well your product, service, or experience meets or exceeds customer expectations. It is not a vanity metric. Research consistently shows that satisfied customers buy more, stay longer, and refer others. Dissatisfied customers do the opposite, and they do it loudly.
Consider the numbers:
- Acquisition cost: Acquiring a new customer costs 5 to 25 times more than retaining an existing one
- Revenue impact: A 5% increase in customer retention can increase profits by 25% to 95%
- Word of mouth: Unhappy customers tell an average of 9 to 15 people about their experience
- Churn prediction: 91% of unhappy customers who do not complain simply leave
The challenge is turning "satisfaction" from a gut feeling into actionable data. That is exactly what CSAT and CES do. Each metric captures a different dimension of the customer experience, and understanding both gives you a far richer picture than either one alone.
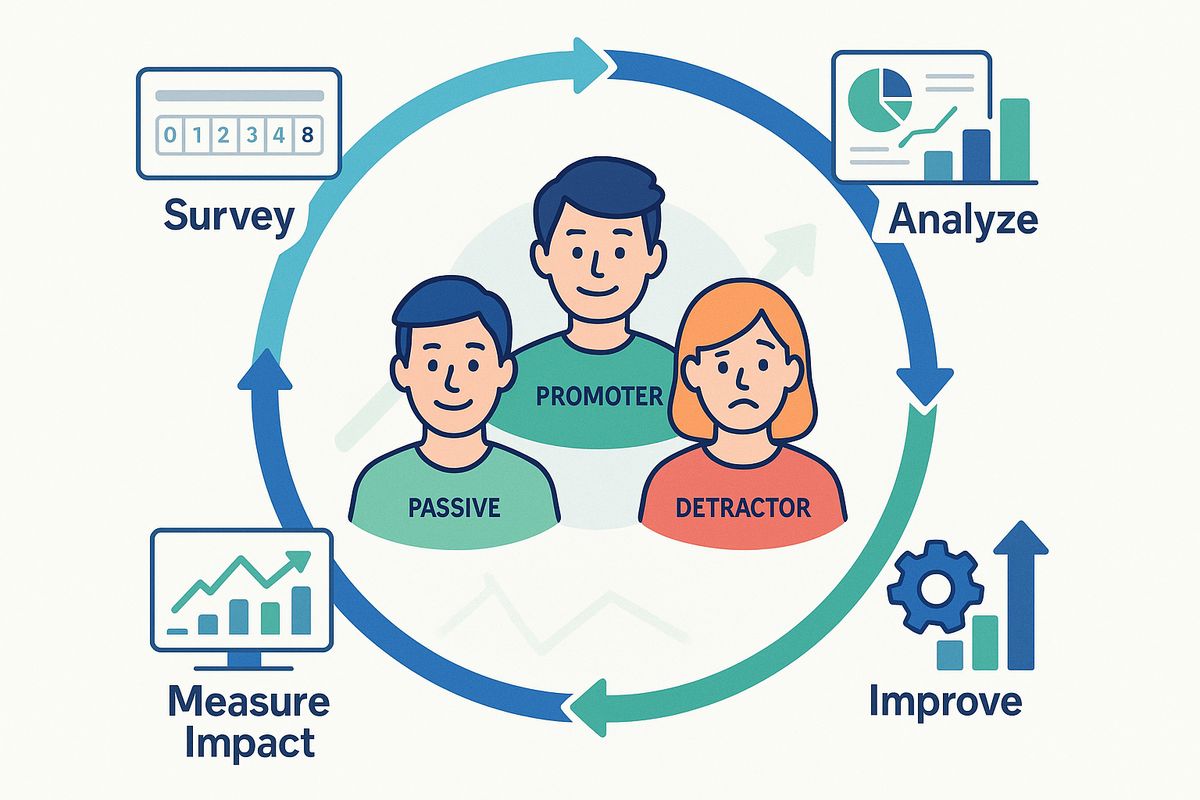
Key insight: Satisfaction is not a single number. Different metrics answer different questions. CSAT asks "how happy are you?" while CES asks "how easy was that?" Both matter, and both predict different outcomes.
Understanding CSAT (Customer Satisfaction Score)
The Customer Satisfaction Score is the most direct way to measure how customers feel about a specific interaction, product, or experience. It is simple, versatile, and widely understood across industries.
What CSAT measures
CSAT measures satisfaction with a specific interaction, transaction, or touchpoint. Unlike NPS, which gauges overall loyalty, CSAT zooms in on particular moments in the customer journey. This makes it ideal for identifying exactly where your experience is strong and where it falls short.
Common uses for CSAT include:
- Post-purchase satisfaction: How happy was the customer with their buying experience?
- Support interaction quality: Did the customer feel their issue was resolved?
- Feature satisfaction: How does the customer feel about a specific feature or update?
- Onboarding experience: Was getting started smooth and intuitive?
- Content or resource quality: Did the help article, tutorial, or guide actually help?
The CSAT formula and calculation
CSAT is typically measured on a 1 to 5 scale, where respondents rate their satisfaction from "very dissatisfied" to "very satisfied." The formula focuses on the percentage of customers who gave positive ratings.
CSAT = (Number of satisfied responses / Total responses) x 100
"Satisfied responses" are typically those who selected 4 (satisfied) or 5 (very satisfied) on a 5-point scale.
Let us walk through an example:
Step 1: Collect responses
You survey 300 customers after a support interaction and get these results:
- Very satisfied (5): 120 responses
- Satisfied (4): 90 responses
- Neutral (3): 45 responses
- Dissatisfied (2): 30 responses
- Very dissatisfied (1): 15 responses
Step 2: Count satisfied responses
Satisfied responses (4 and 5): 120 + 90 = 210
Step 3: Apply the formula
CSAT = (210 / 300) x 100 = 70%
Your Customer Satisfaction Score is 70%.
Scale variations: While a 1-5 scale is most common, some companies use 1-7, 1-10, or even emoji scales. The principle is the same: calculate the percentage of positive responses out of total responses. Just be consistent so you can track trends over time.
When to use CSAT surveys
CSAT works best when you need feedback on a specific moment or interaction. Here are the most effective touchpoints:
After support interactions:
- Immediately after a ticket is resolved or a chat ends
- Measures the quality of support, not just the resolution
- Helps identify training needs for support teams
After purchases or transactions:
- Right after checkout or delivery
- Captures the buying experience while it is fresh
- Identifies friction in your sales or fulfillment process
After onboarding:
- At key milestones during the onboarding journey
- Reveals where new users struggle or get confused
- Helps improve first impressions and time to value
After product updates or feature releases:
- A few days after users have had time to try the new feature
- Validates whether changes actually improved the experience
- Provides early warning if updates caused problems
CSAT question examples
The standard CSAT question is simple, but you can adapt it to fit different contexts:
- General: "How satisfied are you with your experience today?"
- Support: "How satisfied are you with the help you received?"
- Product: "How satisfied are you with [feature name]?"
- Purchase: "How satisfied are you with your purchase experience?"
- Onboarding: "How satisfied are you with the setup process so far?"
Pro tip: Always follow up with an open-ended question like "What could we have done better?" or "What did you like most about this experience?" The score tells you how satisfied they are; the text tells you why.
CSAT benchmarks by industry
CSAT scores vary by industry because customer expectations differ. Here are typical benchmarks:
- SaaS / software: 72% - 82%
- E-commerce / retail: 76% - 86%
- Financial services: 70% - 80%
- Healthcare: 72% - 80%
- Telecommunications: 60% - 70%
- Travel and hospitality: 74% - 84%
- Insurance: 70% - 78%
- Professional services: 78% - 88%
As with any benchmark, your own trend over time matters more than how you compare to industry averages. A company improving from 65% to 75% is making meaningful progress, regardless of where the industry average sits.
Understanding CES (Customer Effort Score)
The Customer Effort Score measures something different from satisfaction: it measures how easy or difficult it was for a customer to accomplish what they wanted. Research by the Corporate Executive Board (now Gartner) found that reducing customer effort is a stronger predictor of loyalty than increasing delight.
What CES measures
CES measures the perceived effort a customer had to expend to complete a task, resolve an issue, or achieve a goal. The underlying principle is straightforward: customers do not want to work hard to use your product or get help. When they do, they leave.
CES is especially valuable for:
- Self-service experiences: Could the customer find what they needed on their own?
- Support resolution: How much effort did it take to get help?
- Product usability: How easy is it to accomplish key tasks?
- Process evaluation: How smooth are checkout, signup, or onboarding flows?
- Cross-channel experiences: Did the customer have to repeat themselves across channels?
The CES formula and scale
CES is typically measured on a 1 to 7 scale, where 1 means "very difficult" and 7 means "very easy." The standard question is a statement that customers agree or disagree with.
The CES question: "[Company/product] made it easy for me to [complete task / resolve issue]."
Scale: 1 (strongly disagree) to 7 (strongly agree)
There are two common ways to calculate CES:
Method 1: Average score
CES = Sum of all scores / Number of responses
This gives you a number between 1 and 7, where higher is better.
Method 2: Percentage of easy responses
CES = (Number of responses scoring 5, 6, or 7 / Total responses) x 100
This gives you a percentage that is easier to communicate and compare.
Let us calculate both using an example:
You survey 200 customers after a support interaction:
- Score 7 (strongly agree): 60 responses
- Score 6: 50 responses
- Score 5: 30 responses
- Score 4 (neutral): 25 responses
- Score 3: 15 responses
- Score 2: 12 responses
- Score 1 (strongly disagree): 8 responses
Method 1: (60x7 + 50x6 + 30x5 + 25x4 + 15x3 + 12x2 + 8x1) / 200 = 1047 / 200 = 5.24
Method 2: (60 + 50 + 30) / 200 x 100 = 70%
Which method to use? Both are valid. The average score (method 1) is better for detailed analysis and tracking small changes. The percentage method (method 2) is easier to communicate to stakeholders and compare across teams.
When to use CES surveys
CES is most powerful when used right after a customer completes a specific task or interaction. The key is to measure effort at the moment it happened, not days later when the memory has faded.
Best use cases for CES:
- After support interactions: Did the customer struggle to get their issue resolved? Did they have to contact you multiple times?
- After self-service tasks: Could the customer complete what they needed using your help center, knowledge base, or FAQ?
- After completing key workflows: How easy was it to set up an account, configure a feature, or complete a checkout?
- After process changes: When you update a workflow, did the change actually make things easier?
- After using new features: Was the new feature intuitive, or did customers struggle to figure it out?
CES question examples
Adapt the standard CES statement to fit different scenarios:
- Support: "AskUsers made it easy for me to resolve my issue."
- Onboarding: "Setting up my account was easy."
- Purchase: "It was easy to complete my purchase."
- Self-service: "I was able to find the information I needed easily."
- Feature usage: "It was easy to [complete specific task] using [feature name]."
You can also follow up with open-ended questions to understand what was difficult:
- "What, if anything, was difficult about this experience?"
- "What would have made this easier?"
- "How many times did you need to contact us before this was resolved?"
Why low effort drives loyalty
The connection between effort and loyalty is well documented. Research has shown that:
- 96% of customers who have a high-effort experience become more disloyal, compared to only 9% with low-effort experiences
- 81% of customers who had a difficult experience say they would share negative feedback with others
- Reducing effort is more effective at preventing churn than trying to exceed expectations
The implication is clear: you do not need to "wow" customers to keep them. You need to make their lives easy. Removing friction from key interactions has a bigger impact on retention than adding delight. That is why CES is such a powerful complement to CSAT.
The effortless experience: Customers do not reward you for going above and beyond. They punish you for making things hard. Focus on removing obstacles before adding bells and whistles.
CSAT vs CES: choosing the right metric
CSAT and CES are both valuable, but they measure different things. Understanding when to use each, and when to use both together, is critical for building a complete satisfaction measurement program.
Key differences
What they measure:
- CSAT: Overall satisfaction with an experience or interaction (emotional, subjective)
- CES: Ease of completing a task or achieving a goal (functional, objective)
What they predict:
- CSAT: General sentiment, likelihood of positive reviews, short-term satisfaction
- CES: Loyalty behavior, likelihood of repurchase, propensity to switch to a competitor
When they diverge:
A customer can be satisfied (high CSAT) but still have found the experience effortful. For example, a customer who called support three times before getting an answer might rate the final resolution highly (high CSAT) but found the overall process exhausting (low CES). That customer is at risk of leaving despite appearing "satisfied."
When to use each
Use CSAT when you want to know:
- How customers feel about a specific interaction or feature
- Whether a product change improved satisfaction
- How your support team is performing
- Whether your onboarding experience leaves a positive impression
Use CES when you want to know:
- Whether a process is too complicated
- Where customers are struggling in your product
- Whether your self-service resources are effective
- If a workflow redesign actually reduced friction
Using both together
The most insightful approach is to use CSAT and CES together at key touchpoints. Here is how:
- After support interactions: Ask both "How satisfied were you with the help you received?" (CSAT) and "We made it easy to resolve your issue" (CES). If CSAT is high but CES is low, you have great agents but a broken process.
- After onboarding: CSAT tells you whether new users are happy; CES tells you whether the setup process itself needs simplification.
- After purchases: CSAT captures the emotional response; CES reveals whether the checkout flow has unnecessary friction.
Practical tip: When using both metrics in a single survey, keep the total survey to 3-4 questions maximum: one CSAT question, one CES question, and one or two open-ended follow-ups. Longer surveys hurt response rates and data quality.
How to combine CSAT, CES, and NPS for a complete picture
Each of the three major satisfaction metrics captures a different dimension of the customer experience:
- NPS (Net Promoter Score): Measures overall loyalty and likelihood to recommend. Best for tracking long-term brand health and predicting growth.
- CSAT (Customer Satisfaction Score): Measures satisfaction with specific interactions. Best for evaluating individual touchpoints and team performance.
- CES (Customer Effort Score): Measures ease of interaction. Best for identifying friction and predicting churn.
Here is a practical framework for deploying all three:
Relationship level (quarterly):
- Send an NPS survey to all active customers
- Track loyalty trends over time
- Segment by customer type, plan, or usage level
Interaction level (event-triggered):
- Use CSAT after support interactions, purchases, and onboarding milestones
- Use CES after self-service tasks, complex workflows, and process completions
- Compare scores across touchpoints to find your weakest links
Connecting the dots:
- Correlate low CES scores with detractors in your NPS data
- Identify which CSAT touchpoints most influence overall NPS
- Prioritize improvements where CES is low and CSAT is dropping
The metrics triangle: NPS tells you the "what" (loyalty state). CSAT tells you "how they feel" (satisfaction). CES tells you "why" (effort). Together, they give you a three-dimensional view of customer experience that none can provide alone.
Best practices for satisfaction surveys
Collecting satisfaction data is only as good as the surveys you send. Poorly designed or poorly timed surveys produce unreliable data and annoy your customers. Here are the practices that separate useful surveys from noise.
Keep surveys short
Every additional question reduces your response rate. For CSAT and CES surveys, aim for the minimum:
- Ideal: 1 rating question + 1 open-ended follow-up = 2 questions total
- Acceptable: Up to 4 questions for combined CSAT + CES surveys
- Too long: Anything over 5 questions for a transactional survey
Studies show completion rates drop by roughly 15% for every additional question beyond the first two. A 2-question survey might get a 40% response rate; a 10-question survey might get 10%.
Time them right
The timing of your survey directly affects the quality of responses:
- CSAT after support: Send immediately after the interaction closes, while the experience is fresh
- CSAT after purchase: Send 1-3 days after delivery, once the customer has had time to evaluate
- CES after a workflow: Trigger the survey at the completion of the specific task you want to measure
- CES after self-service: Display an embedded survey immediately after the customer finishes using a help article or tool
Avoid sending surveys at the wrong moment: do not ask about satisfaction before the experience is complete, and do not wait so long that customers have forgotten the details.
Act on the feedback
The fastest way to destroy your survey program is to collect feedback and do nothing with it. Customers who take the time to respond expect their input to matter.
Build a feedback action process:
- Review daily: Scan new responses every day, especially low scores
- Categorize weekly: Group feedback by theme (product, support, process, pricing)
- Prioritize monthly: Identify the top 2-3 issues to address based on frequency and impact
- Report quarterly: Share progress with the team and celebrate improvements
Close the loop
Closing the feedback loop means letting customers know their feedback was heard and acted upon. This has a powerful effect on loyalty:
- For dissatisfied customers: Reach out personally, acknowledge the issue, and explain what you are doing to fix it
- For satisfied customers: Thank them and ask if there is anything that could make their experience even better
- For everyone: When you make improvements based on feedback, announce them. "You asked, we listened" messages drive engagement
Customers who see their feedback lead to changes become more engaged, more loyal, and more likely to respond to future surveys. It creates a virtuous cycle.
The feedback loop effect: Companies that close the loop on customer feedback see response rates increase by 15-25% on subsequent surveys and report higher overall satisfaction scores even without making product changes.
Common mistakes to avoid
Even well-intentioned satisfaction programs can fail if they fall into common traps. Here are the mistakes that undermine your data and what to do instead.
Mistake 1: Surveying too often
Sending surveys after every minor interaction leads to survey fatigue. Customers stop responding, and the ones who do are disproportionately either very happy or very unhappy, skewing your results.
What to do instead: Set frequency limits. No customer should receive more than one survey per month. For relationship surveys, quarterly is the sweet spot. Track response rates, and if they drop below 15%, you are probably over-surveying.
Mistake 2: Leading questions
Questions like "How great was your experience?" or "We hope you enjoyed our service, how would you rate it?" bias responses upward. Leading questions produce artificially high scores that do not reflect reality.
What to do instead: Use neutral language. "How satisfied were you with your experience?" is neutral. "How satisfied were you with the excellent service?" is not.
Mistake 3: Ignoring the silent majority
Low response rates mean you are hearing from the extremes. The customers who love you and the ones who are angry respond. The large middle group that is quietly disengaged often stays silent and then churns without warning.
What to do instead: Make surveys as easy as possible. Use embedded surveys that appear in context rather than requiring customers to click through emails. Offer multiple response channels. Keep surveys to 2 questions.
Mistake 4: Not segmenting results
A company-wide CSAT of 75% hides important variations. Your enterprise customers might be at 85% while your self-service customers are at 55%. Without segmentation, you cannot prioritize effectively.
What to do instead: Segment results by customer type, product, support channel, geography, and customer tenure. The segments where satisfaction is lowest and churn is highest are your biggest opportunities.
Mistake 5: Treating the score as the goal
When teams are incentivized to improve the number rather than the experience, they game the system. They cherry-pick who gets surveyed, coach customers on how to respond, or avoid surveying at risky touchpoints.
What to do instead: Incentivize improvement in qualitative themes, not just the score. Reward teams for reducing the number of complaints about specific issues, not for hitting an arbitrary CSAT target. Survey all customers, not just the ones likely to rate you well.
Mistake 6: Not combining metrics
Using only CSAT or only CES gives you an incomplete picture. High CSAT with low CES means customers are satisfied but struggling, a combination that leads to churn. Low CSAT with high CES means the process is easy but the outcome is disappointing.
What to do instead: Use CSAT and CES together at key touchpoints, and layer in NPS for the relationship-level view. Each metric tells a different part of the story.
Building a satisfaction measurement program with AskUsers
AskUsers provides the tools you need to measure, track, and act on customer satisfaction data across all three major metrics.
CSAT and CES surveys made simple
With AskUsers, you can set up professional satisfaction surveys in minutes:
- Pre-built templates: Start with CSAT or CES templates that follow best practices out of the box
- Custom scales: Choose from 1-5, 1-7, or 1-10 scales depending on your needs
- Follow-up questions: Add open-ended questions to capture the "why" behind every score
- Embeddable widgets: Place surveys directly on your website or in your app for higher response rates
- Mobile-optimized: Every survey looks great and works smoothly on any device
Analytics and reporting
AskUsers automatically calculates your scores and tracks trends so you can focus on insights rather than spreadsheets:
- Real-time dashboards: See your CSAT and CES scores update as responses come in
- Trend tracking: Monitor how scores change over time to measure the impact of improvements
- Response analysis: Review individual responses and qualitative feedback in one place
- Webhook integrations: Send response data to your existing tools and workflows automatically
Privacy and compliance
- GDPR-compliant: Built with privacy in mind, with proper data handling and consent management
- Anonymous responses: Let customers share honest feedback without identifying themselves
- Data ownership: Your feedback data belongs to you, always
Getting started
- Choose your metric: Start with CSAT for satisfaction measurement or CES for effort measurement
- Create your survey: Use an AskUsers template or build your own in minutes
- Embed or share: Add the survey to your website, share via link, or trigger via webhooks
- Collect responses: Watch feedback come in through your dashboard
- Take action: Review scores and qualitative feedback, then prioritize improvements
Frequently asked questions
What is a good CSAT score?
A CSAT score above 75% is generally considered good, and above 85% is excellent. However, benchmarks vary by industry. The most important comparison is against your own past performance. Consistent improvement matters more than hitting a specific number.
What is a good CES score?
On a 7-point scale, an average CES above 5.5 indicates that most customers found the experience easy. Using the percentage method, aim for 70% or more of customers rating the experience as easy (5, 6, or 7). As with CSAT, track your trend over time.
Should I use CSAT or CES?
Use CSAT when you want to measure how customers feel about an experience. Use CES when you want to measure how easy it was. Ideally, use both. They answer different questions and together provide a more complete picture than either one alone.
How is CSAT different from NPS?
CSAT measures satisfaction with a specific interaction or touchpoint. NPS measures overall loyalty and willingness to recommend. CSAT is tactical (it helps you improve specific moments); NPS is strategic (it tracks the overall relationship). Use CSAT at interaction level and NPS at relationship level.
How often should I send satisfaction surveys?
For transactional CSAT and CES surveys, send them after each relevant interaction, but limit each customer to no more than one survey per month. For relationship-level NPS, quarterly is ideal. Always monitor response rates: if they drop significantly, reduce frequency.
Can I use CSAT, CES, and NPS together?
Yes, and you should. Use NPS quarterly for the big-picture loyalty view. Use CSAT and CES at specific touchpoints for tactical insights. The three metrics complement each other: NPS tells you "where you stand," CSAT tells you "how they feel," and CES tells you "how hard it was."
What is the best scale for CSAT?
A 5-point scale (1 = very dissatisfied, 5 = very satisfied) is the most widely used and easiest for customers to understand. It provides enough granularity for meaningful analysis without being overwhelming. Be consistent with your chosen scale across all surveys.
How do I improve a low CES score?
Focus on reducing friction at the specific touchpoint where CES is low. Common fixes include simplifying workflows, reducing the number of steps to complete a task, improving self-service resources, and ensuring customers do not have to repeat information across channels. Ask the follow-up question "what was difficult?" to identify specific pain points.
Do satisfaction surveys actually improve satisfaction?
Surveys alone do not improve anything. What improves satisfaction is acting on the feedback and closing the loop with customers. Companies that systematically collect feedback, make improvements, and communicate changes see measurable gains in all three metrics over time.
Start measuring customer satisfaction today
AskUsers makes it easy to create CSAT and CES surveys, track your scores in real time, and identify exactly where to improve. Set up your first satisfaction survey in minutes.